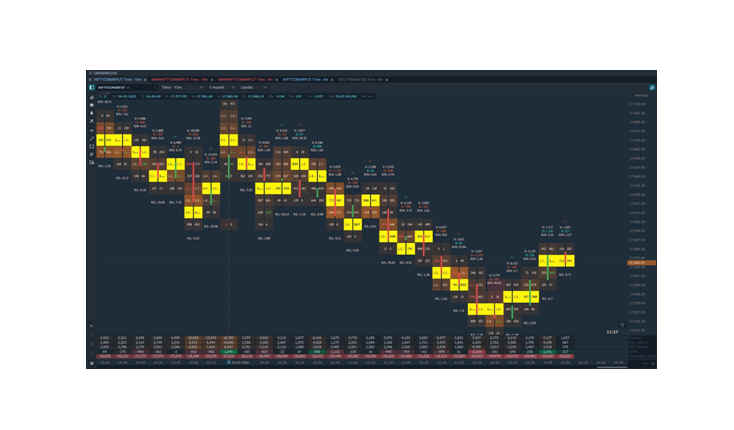
Order flow charts
Order flow charts are a type of technical analysis tool that displays the buy and sell orders for a particular asset in real time. These charts are created by aggregating data from different trading platforms and exchanges, which allows traders to see the actual flow of orders in the market.
To use order flow charts in trading, traders look for patterns and anomalies in the order flow data that may indicate potential trading opportunities. For example, a large number of buy orders at a specific price level may suggest that there is strong demand for the asset and that the price may be about to increase. Alternatively, a large number of sell orders may indicate that there is a significant supply and that the price may be about to decrease.
Order flow charts can be plotted on a variety of timeframes, ranging from tick charts (which show individual trades) to hourly or daily charts. The best timeframe to use depends on the trader's trading style and preferences. Short-term traders may prefer to use tick or minute charts, while longer-term traders may prefer to use hourly or daily charts.
There are several strategies that traders can use when analyzing order flow charts:
1. Watching for large orders: Traders can look for large buy or sell orders that may indicate significant demand or supply for an asset. These large orders can provide clues about potential price movements and can be used to inform trading decisions.
2. Monitoring order flow imbalances: Traders can monitor the order flow data for imbalances between buy and sell orders. For example, if there are significantly more buy orders than sell orders, this may suggest that there is strong demand for the asset and that the price may be about to increase.
3. Using order flow to confirm trends: Traders can use order flow data to confirm trends that are already visible on price charts. For example, if there is a clear uptrend on a price chart and the order flow data shows a high volume of buy orders, this may confirm the strength of the trend.
4. Using order flow to identify support and resistance levels: Traders can use order flow data to identify potential support and resistance levels in the market. For example, if there is a significant volume of buy orders at a specific price level, this may suggest that there is strong demand and that the price is unlikely to drop below that level.
5. Combining order flow with other technical analysis tools: Order flow data can be used in conjunction with other technical analysis tools, such as chart patterns and indicators, to provide a more complete view of the market.
Advantages:
1. Provides real-time information: Order flow charts provide real-time information about the actual flow of buy and sell orders in the market, which can be useful for identifying potential trading opportunities.
2. Helps identify market trends: By analyzing the order flow data over time, traders can identify trends in the market and potential support and resistance levels.
3. Can be used in conjunction with other technical analysis tools: Order flow charts can be used in combination with other technical analysis tools, such as chart patterns and indicators, to provide a more complete view of the market.
Disadvantages:
1. Requires specialized knowledge: Order flow analysis requires specialized knowledge of the market and the different types of orders that traders use. It can be challenging for novice traders to understand and use effectively.
2. Limited historical data: Order flow charts are based on real-time data, which means that there is limited historical data available for analysis.
3. Can be expensive: Access to real-time order flow data can be expensive, which may make it inaccessible to some traders.
In summary, order flow charts can be a useful tool for identifying potential trading opportunities and analyzing market trends. However, they require specialized knowledge and can be expensive to access, and the limited historical data may make it challenging to use for longer-term analysis. Traders should consider their individual needs and preferences when deciding whether to use order flow charts in their trading strategy.

